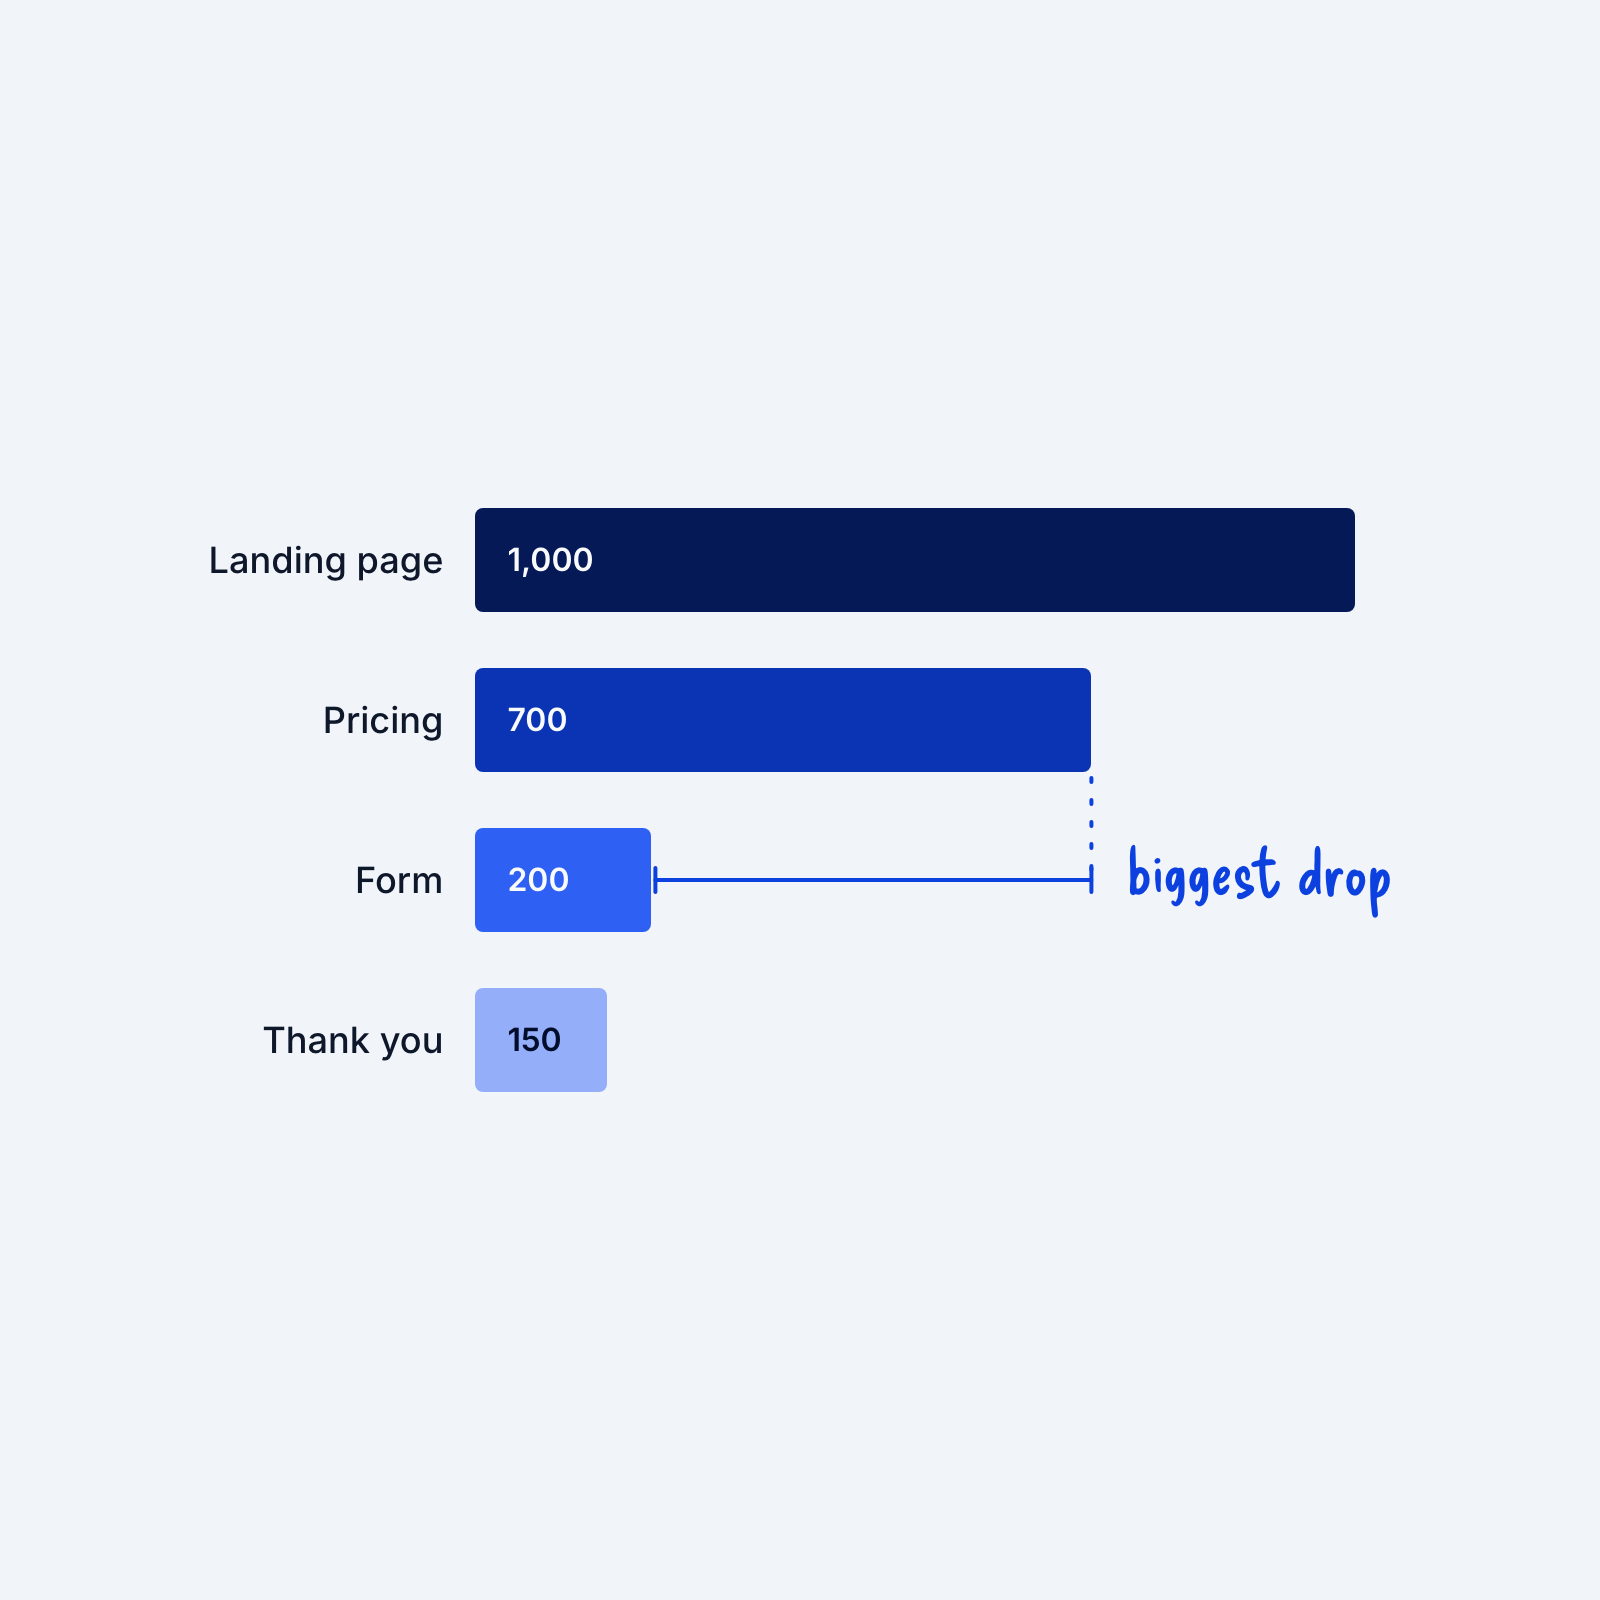
A funnel report shows how many visitors reach each step of a path, like the landing page, the pricing page, the form and the thank-you page. Some drop-off at every step is normal. The step with the biggest drop is the one to look at first.
That step is called the “bottleneck” and it’s usually where your design needs the most work. If half your visitors reach the pricing page but only a few start the form, the pricing page or the form is the place to dig in. Fixing that step tends to have a bigger effect on the final number than polishing pages that already work. Most analytics tools, including Google Analytics, can build this kind of report easily.